Government figures have shown a “shocking rise” in disability hate crime on trains. That’s the verdict of one union. It says this is a “wake-up call” over the erosion of the UK’s rail network. The stats also highlight the ongoing lack of true accessibility on public transport for disabled people.
Disabled people: transport discrimination
The Department for Transport (DfT) has released a set of statistics about disabled people’s access to transport in England in 2019/20. Overall, the figures show that non-disabled people still have better options than disabled people.
For example, disabled people used buses and taxis more than non-disabled people:
- Disabled people made 55% more trips by taxi.
- They made 40% more trips by bus.
When disabled people travelled by car, around a third of them were a passenger. This compares to a fifth for non-disabled people. It ties in with driving licence figures. The DfT found that of those aged 17-64:
- 60% of disabled people held a driving licence. The figure was 78% for non-disabled people.
Given the modifications that are available for cars, the number of disabled people with driving licences should be higher. The stats also revealed disabled people’s feelings about public transport.
Less satisfied overall
The DfT found that outside of London:
- 47% of disabled people were “satisfied” with “overall transport and highways services”. The figure was 50% for non-disabled people.
- 60% of disabled people/59% of non-disabled people were satisfied with local bus services
- 67% of disabled people/65% of non-disabled people were satisfied with taxi services.
- 52% of disabled people/51% of non-disabled people were satisfied with cycle facilities.
- 46% of disabled people/56% of non-disabled people were satisfied with pavements and footpaths.
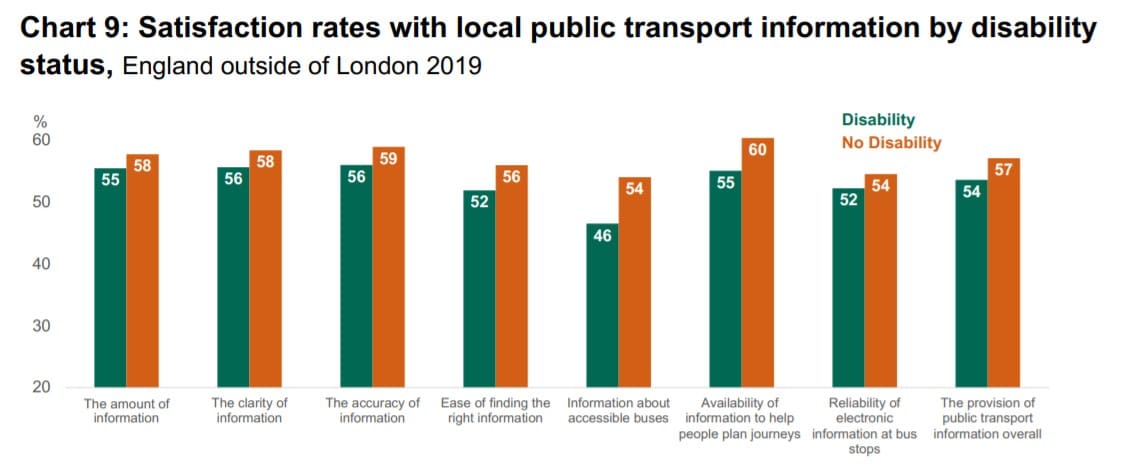
Overall disabled people were less satisfied across the board on transport information:

But looking at the DfT stats in more detail, certain problem areas emerge.
Varying issues
Taxis were one issue. In London, all black cabs were accessible. But outside the capital, the figure drops to 82%. Then, for licenced vehicles overall (for example, private hire firms) in London, only 17% were accessible. This dropped to just 10% outside the capital. Also, as the DfT noted, police in England and Wales prosecuted 32 cases of discrimination against disabled people by taxi drivers or firms. This was for the year ending 31 March 2019. These were for:
- Assistance dog refusals.
- Wheelchair user discrimination.
The DfT said:
The number of prosecutions have in general been increasing.
Other modes of transport fared varyingly in terms of satisfaction:
- 46% of disabled ferry passengers were satisfied.
- 71% of passengers with “restricted mobility” rated airports “good or excellent”.
Invisible illnesses
Another figure stood out. It was about so-called “maritime” transport (cruise ships and ferries). The DfT said that:
- Maritime transport satisfied 60% of disabled people living with visible impairments.
- But only 42% of disabled people with invisible conditions were happy with it.
It’s important to note this analysis of visible/invisible illnesses and impairments was not available for other transport. The government must give more insight into this area. Because 25% of disabled people live with a mental health condition. Also, a further 18% live with invisible conditions, illnesses, or impairments.
Rail travel
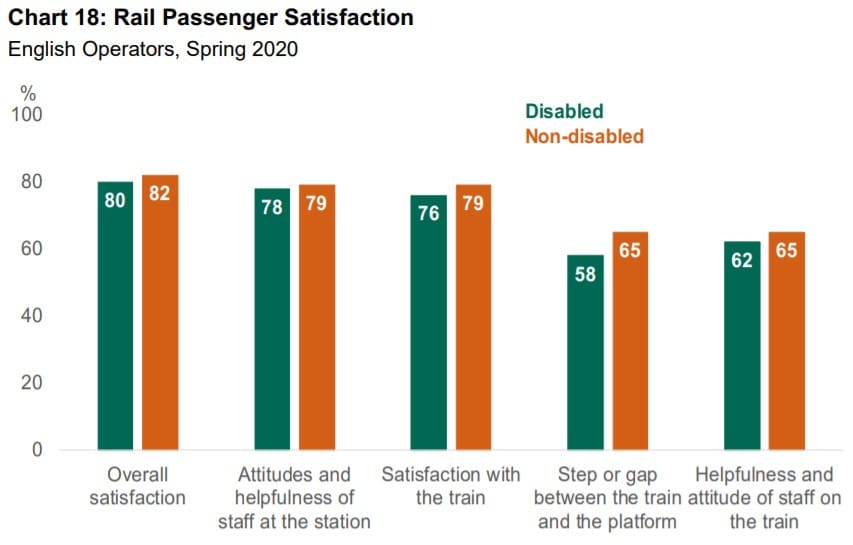
Crucially, disabled people’s satisfaction with rail was lower than non-disabled people’s. The biggest difference was in the steps between trains and platforms:

And it was on rail travel where hate crime saw a surge.
Hate crime surging
The DfT noted that:
Between 2014 and 2016, the numbers of disability related hate crime incidents in England reported to the British Transport Police decreased by 37%…
However, since 2016 the number of incidents has seen a slow but steady increase, increasing by 24%
This fits with the bigger picture on disability hate crime in England and Wales. In 2019/20:
- There were over 7,300 disability hate crimes.
- But the police only charged 1.6% of these.
- Cases of violence rose by 16% to 3,628.
- Online hate crimes rose by 46%. They made up one in 10 of all reported ones.
“Cost-cutting”
On the rail network, the RMT union was clear why it thinks hate crime has risen. It blamed the:
cost-cutting that has emptied staff from trains and stations
The Canary previously reported on this. As we wrote in 2020:
- Train companies only fully staffed 10% of UK stations.
- They staffed 45% “some of the time”.
- Train companies never staffed the other 45%.
A similar thing has happened on board trains. So, it may be of little wonder that hate crime is up. Moreover, this could be why disabled people’s satisfaction with rail is lower than non-disabled people’s.
As Labour MP Debbie Abrahams tweeted:
More than 25 years on from the #Disability Discrimination Act & 11 years on from signing the #UNCRPD – we have to change. #Weareallbornfreeandequal in dignity and rights #HumanRights https://t.co/KvG6FznX6E
— Debbie Abrahams (@Debbie_abrahams) March 26, 2021
So, it seems that while UK laws reflect the need for disabled people to have equal access to transport the reality is different. It’s clear that transport operators are still leaving disabled people disadvantaged. And the government also needs to do more to ensure equality is ensured across the country.
Featured image via The Canary


